What the evaluation found
The result depends on the question. Individual timing nearly tied the simple baseline; the throughput result needs a larger evaluation window.
Open-to-merge interval coverage · 183 pull requests
85% target coverage · Range shows unresolved-case bounds
174 PRs had resolved; nine remained open. These are coverage bounds, not confidence intervals. Both approaches have the same reported range. Model selection continued on the nominal held-out window.
Historical evaluation record, September 21 to October 2, 2026.
CRPS in hours · lower is better · common zero-based scale
The open-to-merge result is a near tie. First-passing-review forecasts had 171 resolved and six unresolved PRs. CRPS scores the predictive distribution; it is not mean timing error.
Historical evaluation record, September 21 to October 2, 2026.
Observed coverage and computed 95% Wilson intervals
85% forecast-interval target · Dot = observed rate; line = sampling uncertainty
Wilson bounds are approximately 72–100% and 24–76%. Ten days is too small to establish general performance. Three Monty intervals covered every possible count; only seven were nontrivial. These confidence intervals describe estimated coverage, not uncertainty around an individual forecast.
Historical evaluation record, September 21 to October 2, 2026.
Exact values, units, and source scope
| Measure | Monty | Baseline |
|---|---|---|
| Open-to-merge coverage | 86–89% | 86–89% |
| Median interval width | 24.32 hours | 23.44 hours |
| Open-to-merge CRPS | 4.93 hours | 5.05 hours |
| Review-to-merge coverage | 81–83% | 75–76% |
| Review-to-merge CRPS | 4.12 hours | 4.36 hours |
| Throughput coverage | 10/10 days | 5/10 days |
| Throughput CRPS | 0.80 work items | 2.24 work items |
These figures use summary values only. No per-day observations, per-PR forecast series or synthetic time series are shown. The confidence bounds above are recomputed with the Wilson method (z = 1.95996398454) from the two day counts.
Download the plotted valuesWho it is for
Engineering leads comparing expected pull-request completion times and daily throughput.
The problem
A planning forecast needs to show uncertainty and beat a simple baseline. A plausible completion date is not enough.
How it is used
The evaluated workflow uses historical pull-request data to generate 1,000 simulated outcomes and a central 85% interval. Compare those forecasts with a historical-duration baseline for PR timing and a binomial baseline for daily throughput. This page describes the evaluation, not a public product.
How it works
Recency and workload signals feed the forecast. Evaluation measures interval coverage, interval width, and CRPS, keeping unresolved pull requests in the accounting. Lower CRPS is better; it is not average timing error.
A pull request that is still open has not merged yet, but dropping it would leave only the ones that merged. Monty models the wait at each stage with a recency-weighted Kaplan-Meier survival curve, which counts recently opened, still-open pull requests as censored observations. The chance that a pull request merges at all uses Beta-Binomial shrinkage toward the pooled rate, so a state with few examples leans on the overall rate.
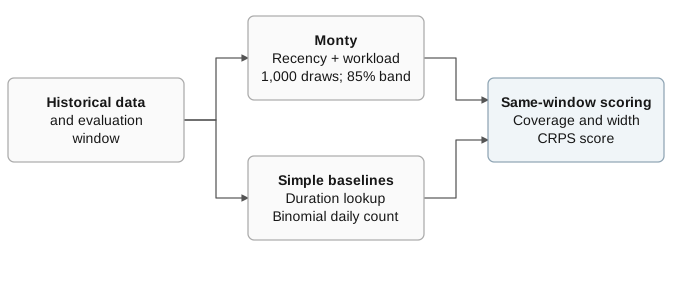
The same evaluation window is used for the model and its simple baselines. Selection on this window limits the strength of the comparison.
Open diagram at full size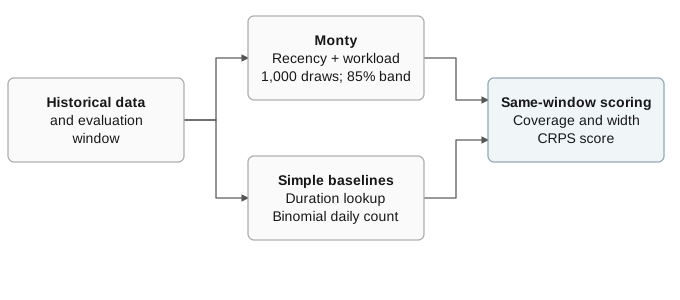
Read the workflow as text
- Historical data and one evaluation window feed both Monty and the simple baselines.
- Monty uses recency and workload signals, draws 1,000 simulated outcomes, and reports a central 85% interval.
- The baselines are a historical duration lookup and a binomial daily count.
- Both are scored on the same window for coverage, interval width and CRPS.
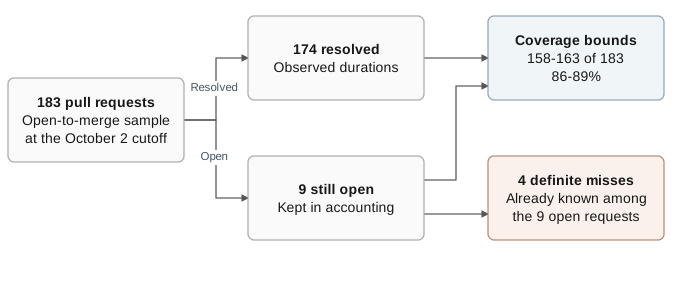
Open-to-merge sample at the cutoff. The unresolved cases create coverage bounds; dropping them would inflate the result.
Open diagram at full size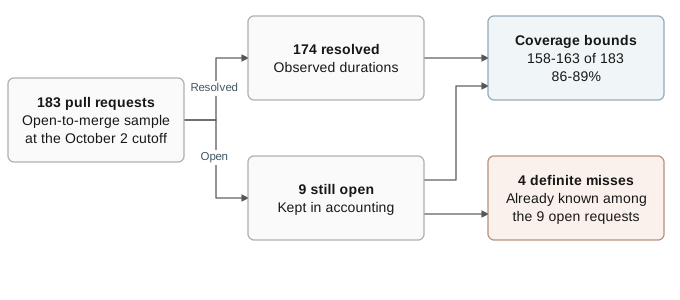
Read the workflow as text
- At the October 2 cutoff, the sample held 183 pull requests.
- 174 had resolved, so their observed durations were available.
- 9 were still open and stayed in the coverage accounting; 4 of them were already definite misses.
- Together they give coverage bounds of 158–163 of 183, or 86–89%.
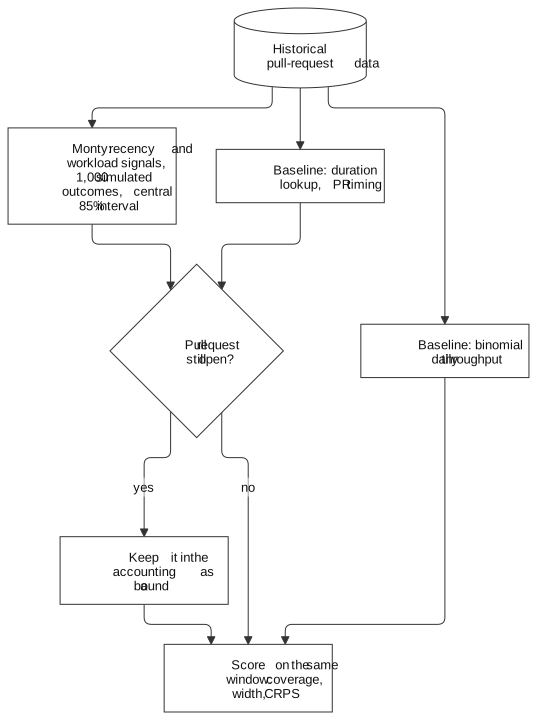
Both approaches were scored on the same window. Model selection continued on that window, which limits the strength of the comparison.
Open diagram at full size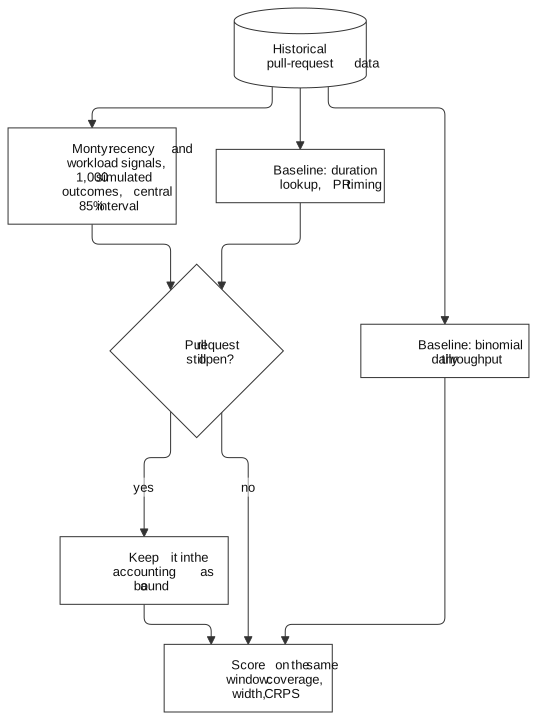
Read the workflow as text
- Historical pull-request data feeds Monty and two simple baselines.
- Monty: recency and workload signals, 1,000 simulated outcomes, central 85% interval.
- Baseline: duration lookup, PR timing. Baseline: binomial daily throughput.
- For PR timing, the question is: pull request still open? If yes, keep it in the accounting as a bound; if no, score it.
- Score on the same window: coverage, width, CRPS. The binomial forecast goes straight to scoring.
A port of the forecast code into a package had to leave every result unchanged. The port was the first of ten planned steps. Its parity test runs the frozen original script and the package on the same synthetic inputs and seed, in 12 cases: three model configurations by four argument cases. A case passes only if the two outputs are byte-identical. In the run below, on October 2, 2026, all 12 passed; the one skipped test needs real data, which this run did not use.
$ ~/project/.venv/bin/python -m pytest -v -p no:cacheprovider ~/project/tests/test_parity_v3.py
============================= test session starts ==============================
platform darwin -- Python 3.14.7, pytest-9.1.1, pluggy-1.6.0 -- ~/project/.venv/bin/python
rootdir: ~/project
configfile: pyproject.toml
collecting ... collected 14 items

~/project/tests/test_parity_v3.py::test_legs_output_matches_legacy[champion-S4-wait-default-runs] PASSED [  7%]
~/project/tests/test_parity_v3.py::test_legs_output_matches_legacy[champion-S4-wait-late-deadline-rolls] PASSED [ 14%]
...
~/project/tests/test_parity_v3.py::test_legs_output_matches_legacy[weekend-mixed-stale-cache] PASSED [ 85%]
~/project/tests/test_parity_v3.py::test_fixture_exercises_every_branch_of_the_legs_output PASSED [ 92%]
~/project/tests/test_parity_v3.py::test_real_data_parity SKIPPED    [100%]

======================== 13 passed, 1 skipped in 0.70s =========================
Current state and planned work
Experimental. The record supports a near tie for individual open-to-merge forecasts and preliminary throughput findings over 10 days. Model selection continued on the nominal held-out window. Exact cache lookup was planned, not established as fixed.
A forecast I cannot rerun is hard to check. Packaging the engine began on October 2, 2026 with the first of ten planned steps. That step required byte-identical output from the package and the frozen original script for three model configurations and four argument cases, on synthetic data. Its recorded test run that day passed. That record covers those cases only; it does not show that every run is reproducible.
Engineering case study
The daily completion forecast looked promising. The forecast for an individual pull request was essentially tied with a simple historical lookup. Keeping both findings changed what I could responsibly claim.
Work: September 21 to October 2, 2026
The question
I worked with agent teams on Monty to estimate when pull requests would merge and how many work items would finish in a day. A useful forecast had to describe uncertainty, not just produce a plausible timestamp. We generated 1,000 simulated outcomes per forecast and reported a central 85% interval. I wanted to know whether that extra machinery earned its complexity against a straightforward baseline.
What we compared
For individual timing, the baseline looked up historical durations. For daily throughput, the comparison was a binomial model. We measured interval coverage, interval width where available, and CRPS. CRPS scores the entire predictive distribution; lower is better. Its units here are hours or work items, but it is not average timing error.
Two different planning clocks
I kept the two timing questions separate. Open-to-merge measures the whole remaining lifecycle from opening a pull request; first-passing-review-to-merge starts later, after that review milestone. The samples therefore have different denominators. A result on one clock cannot stand in for the other. This distinction mattered because the later-stage forecast looked stronger against its baseline, while the full-lifecycle forecast was nearly tied.
Choices and rejected alternatives
I treated coverage and width as a pair. A forecast can cover more outcomes by making its interval so wide that it stops helping a planning decision. In the extreme, an interval from zero to infinity covers every outcome. CRPS is a proper score: in expectation, the best score goes to the forecast whose distribution matches the true one. On a small sample, a poor forecast can still score well by chance. Comparing distribution scores alongside coverage kept that tradeoff visible, especially for the daily-count forecasts. The model retained recency and workload signals. We tried pooling by class and conformal adjustments, then dropped them from the selected approach. The comparison needed to include that selection process: tuning continued on the nominal held-out window, so these results cannot be presented as performance on an untouched test set.
Results with the limits attached
For open-to-merge timing, 174 of 183 pull requests had resolved and nine remained open. Accounting for the nine unresolved pull requests, Monty’s coverage was bounded at 158–163 of 183, or 86–89%, with a median interval width of 24.32 hours and CRPS of 4.93 hours. The historical lookup also covered 86–89%, with a narrower 23.44-hour median interval and CRPS of 5.05 hours. That is a near tie, not a decisive timing win.
Where the signal was stronger
From the first passing review to merge, 171 of 177 pull requests had resolved. Accounting for six unresolved pull requests, Monty’s coverage was bounded at 81–83%, versus 75–76% for the baseline; CRPS was 4.12 versus 4.36 hours. Daily throughput covered all ten observed days, versus five of ten for the binomial baseline, with CRPS of 0.80 versus 2.24 work items. Ten days is a small sample: the Wilson coverage intervals were 72–100% and 24–76%, respectively. Three Monty intervals spanned every possible count, leaving seven nontrivial intervals.
Monty’s engine had replaced an earlier version, so I also checked whether the change helped beyond the same day. A follow-up on the same held-out days compared the two engines on daily throughput one and two days ahead. This engine’s 85% interval covered 9 of 9 and 7 of 8 days; the earlier engine covered 2 of 9 and 3 of 8. One day ahead, CRPS was 0.63 versus 2.00 work items. With eight or nine days each, this is also a small sample.
Checks that changed the reading
Four of the nine still-open pull requests were already definite interval misses. Dropping unfinished work would inflate the apparent result. We also found that caching at whole-minute precision made call order matter: ten of 174 forecasts changed with a different order. The follow-up scorer reproduced the original order; exact lookup was a planned correction, not a completed fix established by this record. There were 35 recorded tests, but some initial failures came from a missing module, so I do not count every initial red as a behavioral defect. The four definite misses were already informative even without final merge times. The other five open cases explain the five-outcome gap between the lower and upper coverage bounds. Scoring only completed merges while silently removing unfinished cases would answer a different, easier question.
The same follow-up found a defect in the earlier engine. One work item depended on an item that was already complete, but the earlier engine dropped completed items, so the dependency was never met. That item finished in none of 200 simulated runs.
What I take from it
The useful outcome was a more specific claim. Daily throughput deserved further evaluation; individual timing still had to beat a cheap baseline. I would keep unresolved cases, freeze model selection before a new evaluation window, and verify deterministic scoring before using these numbers to support a planning promise.
Learnings
What I learned: a more complex forecast can tie a cheap baseline. Excluding unresolved work can make coverage look better than it is, and minute-level caching can make scoring depend on call order.
What changed: the write-up keeps unresolved cases in its bounds and separates the individual-timing result from the 10-day throughput result. The follow-up scorer reproduced the original order; an exact-lookup correction was still planned.
What to test next: freeze model selection before a new evaluation window, verify deterministic scoring, and evaluate throughput on more held-out days.